
A good Statistics Calculator can save US students hours of tedious arithmetic on homework, lab reports and exam prep. Yet with so many free and paid options, it is hard to know which one actually fits a high school stats class or a college course. This guide walks through the best choices and how to pick the right one.
Top Free Online Statistics Calculators
Most students start with a free web tool, and several good options cost nothing. Each one handles a different job, so pick the one that matches your assignment. The table below compares the most popular choices.
| Tool | Best for | Key strength |
|---|---|---|
| Wolfram Alpha | Quick answers and checking work | Accepts plain-English questions and shows steps for many problems |
| Desmos | Graphing data and visualizing distributions | Clean, fast plots that are easy to read |
| GraphPad QuickCalcs | t-tests and basic lab statistics | Simple forms for common tests used in science courses |
Graphing Calculators for Classroom Statistics
Many US high school and college courses rely on handheld graphing calculators for statistics work. Models from Texas Instruments are the common choice, since they are allowed on most standardized tests. They handle one-variable statistics, giving you the mean, median, standard deviation and quartiles from a single list of data. For two-variable work, such as regression, they plot paired data and report the line of best fit.
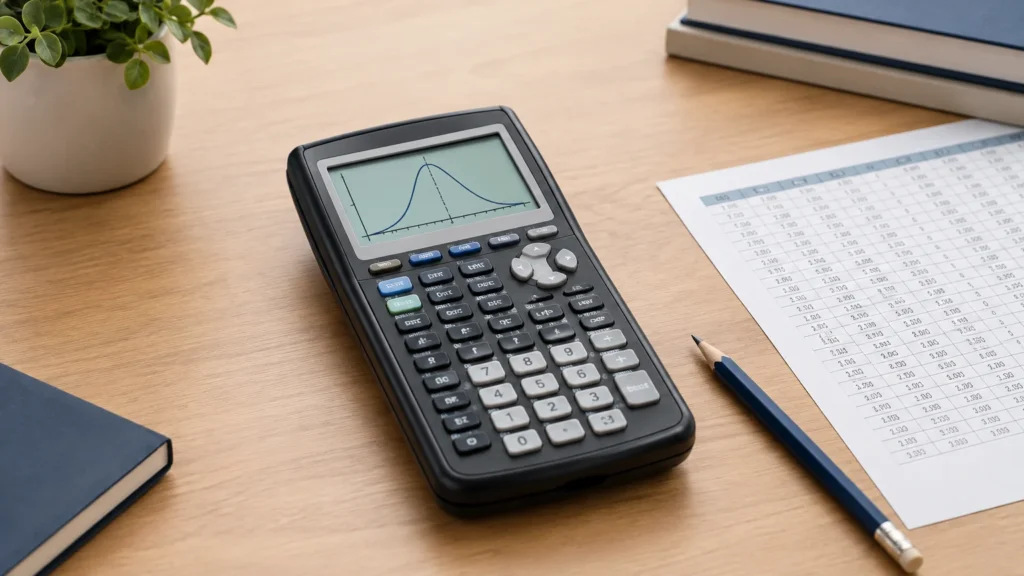
- One-variable stats: mean, median, quartiles and standard deviation
- Two-variable stats: scatter plots and linear regression
- Built-in distributions for probability and hypothesis testing
Desktop and Spreadsheet Options for Serious Analysis
When your dataset grows past a few dozen rows, a phone app or browser tool starts to feel cramped. Spreadsheets and dedicated desktop software handle larger data with ease. Excel is the most common choice for students. It runs descriptive statistics, regression and many built-in functions, including formulas for variance and z-scores. GraphPad Prism is popular in science courses because it offers guided t-tests, ANOVA and clean graphs. Both tools typically require a paid license or a school subscription, so check what your campus provides before you buy anything.
- Excel: flexible for data entry, regression and charts.
- GraphPad Prism: strong for hypothesis tests and lab-style graphs.
How to Choose the Right Statistics Calculator
The right tool depends on what you need to do and where your class or project lives. Start with a few practical questions before you pick one.
- Data size: Small lists fit in almost any tool, but large datasets usually need a spreadsheet or desktop software.
- Required tests: If you need a t-test or z-score, confirm the tool supports it before you commit.
- Step-by-step output: Choose a calculator that shows its working if you are still learning the formulas.
- Cost: Many free options cover basic descriptive work, while advanced packages may require a paid license or a school account.
Check whether your instructor expects a specific tool, since some courses require an approved graphing calculator for exams.
Key Takeaways
- A free online statistics calculator handles mean, median, mode, and standard deviation quickly, which covers most homework and quick checks.
- Graphing calculators suit classroom work and many standardized tests, but confirm the rules for your specific exam first.
- Spreadsheets like Excel and dedicated tools like GraphPad offer more power for larger datasets and deeper analysis.
- Pick the tool that matches your course requirements, data size, and budget, and check whether it shows the steps you need.
Frequently Asked Questions About Statistics Calculator
Is there a free statistics calculator I can use online?
Yes. Several free online tools calculate descriptive statistics such as mean, median, mode, variance, and standard deviation. Many also work on phones and tablets. Free versions may have limits on data size or features, so check what each one includes before you rely on it for an assignment.
What is the difference between a statistics calculator and a spreadsheet?
A statistics calculator is built for quick, focused calculations, often with a simple interface. A spreadsheet such as Excel handles larger datasets, keeps a record of your work, and supports charts and many built-in functions. Spreadsheets take more setup, while calculators are faster for one-off problems.
Can a statistics calculator compute standard deviation and z-scores?
Most statistics calculators compute standard deviation, both population and sample versions, and many also calculate z-scores. Some tools also offer t-tests and other inferential tests. Check the menu or documentation for your tool, since features vary and some only show the final answer without steps.
Are graphing calculators allowed on US standardized tests?
Many US standardized tests allow graphing calculators, but the approved models and rules change over time and differ by exam. Look up the current calculator policy for your specific test on its official website before exam day, and confirm your model is permitted.
What is the difference between population and sample standard deviation on a statistics calculator?
Population standard deviation divides the sum of squared deviations by n, treating the data as the entire group of interest. Sample standard deviation divides by n minus 1, which corrects for estimating the mean from a sample. Most calculators offer both as separate keys or menu options, so check the manual or help menu to confirm which one your calculator labels as sx or σx.
References & Further Reading
- Desmos – Desmos
- Wolfram Alpha – Wolfram Alpha
- Texas Instruments – Texas Instruments
About This Article
This guide was written with AI assistance from publicly available information. Prices, nutrition values and availability can change, so confirm important details with the official source before you decide.
Pingback: Exponent and Root Calculator – Free Online Tool
Pingback: Unit Converter: Free Online Tool for Every Measurement